A while ago I got my own Flipper Zero and immediately tried to write own simple application. Unfortunately they officially support only one editor — VS Code.
I like JetBrains products and use them every day: from GoLand and PhpStorm to Rider and PyCharm. So why would I don’t use CLion to write and debug Flipper Zero’s apps?
CLion is a cross-platform IDE for C and C++ from JetBrains. And while it does support some features for embedded development, there are still some caveats, especially with debugging.
Setup core functionality
CLion syntax highlighting and autocomplete engine works out of the box only with CMake, but it supports
compilation database, which fbt can generate.
So to start:
Clone Flipper Zero firmware repo:
git clone --recursive https://github.com/flipperdevices/flipperzero-firmware.gitBuild firmware, FAPs and create compile database:
./fbt
./fbt faps
./fbt firmware_cdb
Copy
compile_commands.jsonfrombuild/latestto the project root.Open this file with CLion.
Go and find
compile_commands.jsonfile atbuild/latestagain, then click right mouse button and chooseLoad Compilation Database Project.Remove
compile_commands.jsonfrom the project root.Go to
File -> Settings -> Build, Execution, Deployment -> Toolchainsand create toolkit:- C Compiler:
toolchain/x86_64-linux/bin/arm-none-eabi-gcc - С++ Compiler:
toolchain/x86_64-linux/bin/arm-none-eabi-g++ - Debugger:
toolchain/x86_64-linux/bin/arm-none-eabi-gdb-py
- C Compiler:
It should try to sync a project at
Buildtab successfully.
Possible problems and their solutions
CLion does not understand
ccache.Solution 1: remove
ccachefrom system and regenerate compilation database.Solution 2: just remove it from file:
cd built/target
sed -i 's/ccache\ //g' compile_commands.json
CLion cannot find stdlib.
Solution 1: Launch CLion under
fbtenvironment:source scripts/toolchain/fbtenv.sh gtk-launch jetbrains-clion.desktopSolution 2: Replace path to compiler with absolute ones:
cd built/target
sed -i 's/arm-none-eabi-gcc/\/home\/user\/documents\/flipperzero-firmware\/toolchain\/x86_64-linux\/bin\/arm-none-eabi-gсс/g' compile_commands.json
Solution 3: Install the latest
arm-none-eabitoolkit with your system package manager:sudo pacman -S arm-none-eabi-gcc arm-none-eabi-gdb arm-none-eabi-newlib
After this troubleshooting CLion should work as expected: highlighting and autocompleting your code.
Setup debugging
Go to Run Configuration and create your own with type
Remote Debug:- Pick debugger from toolchain you created before.
- Fill
'target remote' argswith content from output of./fbt get_blackmagic - Point to symbol file:
build/latest/firmware.elf
Create a
.gdbinitfile with this content in the project directory:set confirm off set trace-commands on define target remote target extended-remote $arg0 set mem inaccessible-by-default off source debug/flipperapps.py fap-set-debug-elf-root build/latest/.extapps endThen create a
.gdbinitfile in your home directory:set auto-load safe-path /path/to/your/projectBefore first debug session you have to attach Flipper Zero:
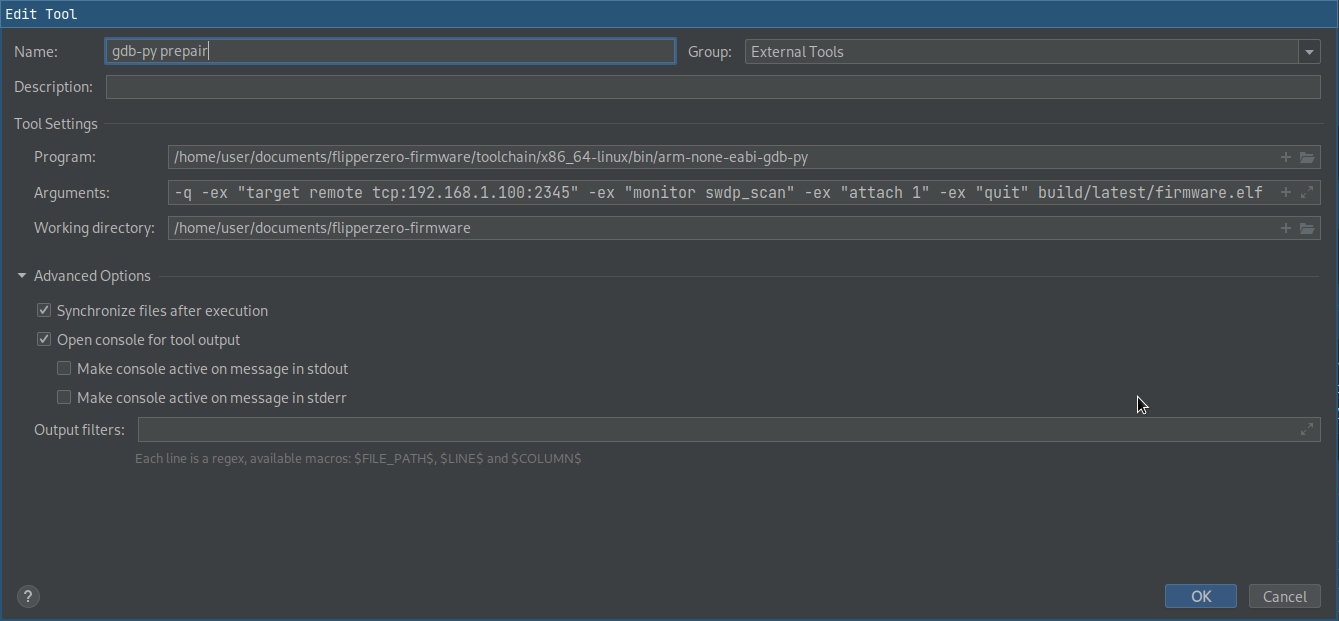
toolchain/x86_64-linux/bin/arm-none-eabi-gdb-py -q -ex "target remote `./fbt get_blackmagic`" -ex "monitor swdp_scan" -ex "attach 1" -ex "quit" build/latest/firmware.elfNow you can set breakpoints and try to debug using the configuration you create. Ensure that your debugger connects successfully, otherwise try to reboot Flipper and start again from step 4.
(Optionally) After successful session of debug you can edit your debug configuration and add in “Before launch” block “External tool” to automate step 4.
UPD: 10 november 2022
Guide has been updated after patches from Flipper Devices team! Now it should work with fewer tricks.
UPD: 25 april 2023
Roman Beltiukov has pointed out in the comments about fap-set-debug-elf-root build/latest/.extapps needed
to be added to the project’s .gdbinit to debug fapps.